3D-FLD: predicting scattered cracks in plane-strain bending
Add contact pressure to the forming limit so that cracks in bent, plane-strain areas of ultra-high-strength steel are flagged where a 2D FLD says the part is fine.
What the problem looks like
In ultra-high-strength steel, a part that is bent over a tool can develop a row of short cracks across a narrow band, with little visible thinning around them. The strain state in that band is plane strain: the sheet is stretched in one direction and held in the other. Strain concentrates in a narrow neck and the steel cracks there, even though the strain looks moderate.
Why a 2D FLD misses it
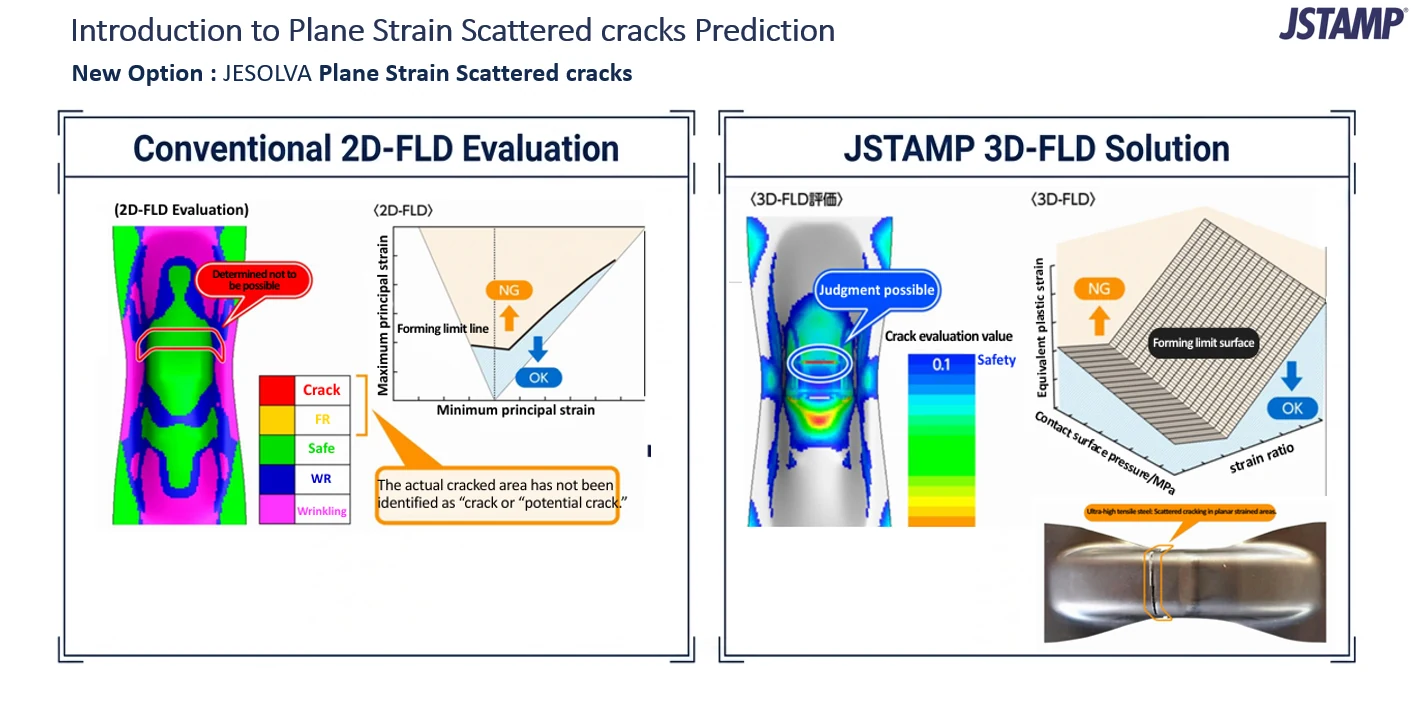
A conventional FLD uses two numbers, the maximum and minimum principal strains, and compares them with a single forming limit curve. In the slide, the 2D evaluation marks the area as not possible to judge: the real cracked area is not identified as a crack or a potential crack.
What the 2D diagram leaves out is the contact between the sheet and the tool. While the sheet bends over a radius it is pressed against the die, and that contact pressure changes how much strain it can take before it necks and cracks. Two points with the same strain pair can have different limits if the pressure is different.
How the 3D-FLD works
- Three inputs instead of two. At each point it takes the equivalent plastic strain, the strain ratio and the contact surface pressure.
- A surface instead of a curve. The limit becomes a forming limit surface in those three axes. Points above it are NG, points below it are OK.
- A crack evaluation value. The result is shown on the part as a color map. In the slide, blue marks the safe end of the scale and the crack band lights up as a high value.
What the example shows
Left of the slide: the 2D FLD paints the part in crack, safe and wrinkling bands, but the actual cracked area is not marked as crack or potential crack. Right of the slide: the 3D-FLD gives a crack evaluation value on the part, and the highlighted band coincides with the scattered cracks in the photo of the real ultra-high-strength steel part.
The developers describe the option as aimed at cracks at protruding features inside a pressed part, which were hard to predict before.
When to use it
- Ultra-high-strength steel parts with bends, beads or protrusions where cracks appeared despite a clean FLD.
- Comparing die radii and bending conditions, since contact pressure changes with them.
- Cases where a 2D FLD and the tryout disagree and you need to know why.
Other options
- Stretch flange cracking: Cracks at a stretched cut edge, judged with the strain gradient.
- Delayed fracture: Hydrogen-related cracks that appear after forming, judged from residual stress.
Sources
Example from the slide above. Product details from the JSOL and JFE Steel announcement (Japanese), which describes the three inputs of the 3D-FLD: equivalent plastic strain, strain ratio and contact surface pressure.
Cracks the FLD did not predict?
Send us the part and the steel grade. We can show how the 3D-FLD compares with the 2D result.